How to Set up a New Observability System
When a business grows quickly, its tech often struggles to keep up. More data and complex apps can easily lead to crashes, and without a clear view of your systems, a minor bug can quickly become a costly outage.
Observability is the solution for a full visibility. It gives you a clear window into your IT environment so you can monitor performance and spot issues before things break. By understanding what’s happening in real-time, you can ensure your systems stay reliable during the most demanding periods.
1. Core components of an observability system - logs, metrics and traces
Now that we understand the critical role observability plays in securing IT infrastructure, the next question is: “How can we implement and set up an effective observability system?”
Let’s start with the most important components, called the three pillars of observability:
Metrics: Metrics show numbers like CPU usage, memory use, and network speed to help you understand how your system is performing in real time. It helps you understand “what is happening right now with your system.”
Logs: Logs record actions and events, so you can see what happened, figure out issues, and track the flow of activity across services. It helps you understand “what is happening in your system over time.”
Traces: Traces follow the journey of a request, helping you spot slowdowns or issues in your system’s flow. It helps you understand “how data is moving through your system.”
These three components help you gain a comprehensive understanding of your system’s health and respond to potential issues faster. Modern observability platforms (like Splunk’s Observability Cloud or others) even incorporate events and real-time analytics on top of these three pillars – often abbreviated as MELT (Metrics, Events, Logs, Traces) – to further enrich insights into system health and user experience.
For more detailed information on setting up this observability system, please refer to our previous blog post, where we discussed the fundamentals of observability, including log management (metrics, logs and traces), and compared various observability technologies.

2. Best practices for setting up your observability system
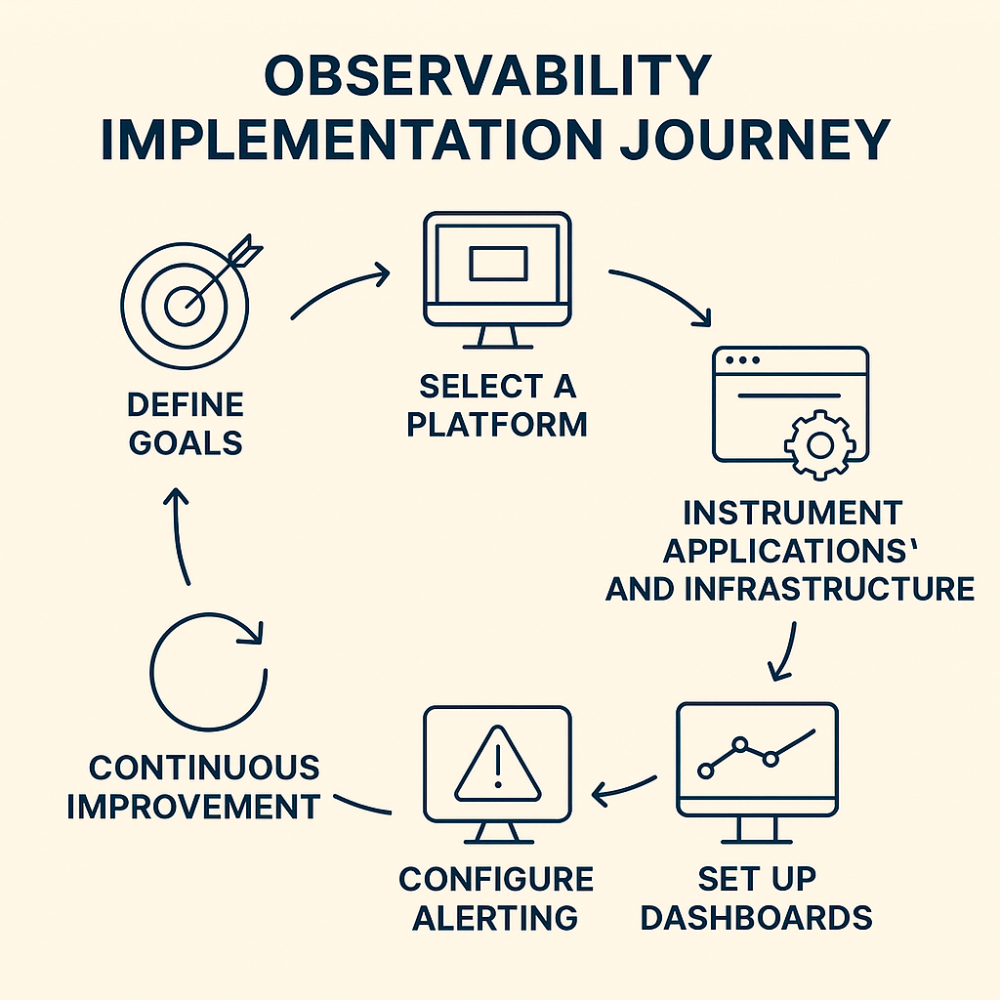
Understand your needs and define clear objectives
Before implementing any observability system, having a clear understanding of what you aim to achieve with observability is crucial. In line with the customers we work with and following industry trends, some common goals include:
- Improve system reliability
- Enhancing user experience across digital platforms
- Proactively identifying and resolving issues
- Reducing MMTR(Mean time to Resolution)
Choose the Right Tools
Selecting a capable, unified platform is crucial. For many companies, a solution like Splunk (with its extensive observability and analytics capabilities) is ideal, while others might consider alternatives like Datadog, New Relic, or open-source stacks. The key is to ensure the platform can handle metrics, logs, and traces together. Using one integrated observability suite prevents the data silos that come from piecing together different tools. For instance, Splunk’s technology can analyze both metrics and event log data within the same platform, giving you correlated insights out-of-the-box. When evaluating platforms, look at features like:
- Dash-boarding
- Alerting
- Scalability
- Ease of integration with your existing systems
- Support for cloud/hybrid environments
Don’t forget to factor in cost as data volumes grow – many platforms charge by data ingested or retained.
Enable Data Collection from Apps and Infrastructure
After you have selected a platform, you can now start tracking what is happening inside your systems. For this, you can:
- Deploy agents or use SDKs to collect metrics from servers (CPU, memory, disk, network), services (request rates, error counts), and dependencies (database performance, external API latency).
- Enable logging in your applications – ensure logs are structured (e.g., in JSON) for easier parsing, and include contextual information (request IDs, user IDs, etc.).
- Implement distributed tracing in your services; many modern frameworks and tools (OpenTelemetry, for example) can auto-instrument code to emit trace spans.
- Every business is unique. Thus, consider collecting business metrics that correlate technical performance with business outcomes.
The goal is comprehensive coverage: every layer (frontend, backend, database, network) should be observable.
Keep Your Data Organized and Under Control
Collecting data is just the beginning — you also need to manage it smartly. Here’s how:
- Organize your data by grouping logs and metrics by app, service, or environment (like test vs. production).
- Set rules for how long to keep data — for example, keep detailed logs for 30 days and keep summary data longer to spot trends.
- Protect sensitive data by controlling who can access it, especially if it includes personal or confidential information.
- Planning this ahead of time helps you avoid clutter, reduce costs, and stay compliant with data regulations.
Create Dashboards That Make Data Easy to Understand
Once your data is coming in, build dashboards that show what’s happening in your systems at a glance.
- Start with a high-level dashboard for decision-makers, showing key stats like uptime, speed, errors, and traffic.
- Then create more detailed dashboards for specific teams or areas, like database performance or cloud costs.
- Use clear visuals like line graphs, heatmaps, and top lists to highlight trends and issues.
- Combine different types of data — for example, show a spike in errors alongside the actual error messages.
- Make dashboards interactive, so you can click on a number and dive deeper into related logs or traces.
Well-designed dashboards turn complex data into useful insights your whole team can act on — fast.
Set Up Smart Alerts and a Solid Response Plan
Good observability isn’t just about spotting issues — it’s about reacting fast when something goes wrong.
- Set alerts for key issues, like high error rates or drops in transactions.
- Use smart features like AI or anomaly detection to catch unusual behavior that might slip past normal rules.
- Make sure alerts go to the right people and attach clear steps (runbooks) on how to fix the problem.
- Run test alerts now and then to be sure your response plan actually works.
- Set up a simple way for your team to handle incidents (like a shared chat and doc for logging what happened).
This way, your team is always ready to act fast and keep things running smoothly.
Make Sure Your Observability Grows With You
As your business grows, your observability setup needs to scale and improve too.
- Choose tools that can handle more data as your systems expand.
- Every time you add a new service or tool, make sure it’s monitored from day one.
- Watch the performance of your observability system itself — it needs to keep up, too!
- Regularly check which data is actually useful and remove what’s not.
- Keep improving your setup based on feedback — maybe your engineers need more trace detail, or your execs want a new dashboard metric.
Observability isn’t a one-time task — it’s an ongoing part of how you grow smarter and faster.
3. What problems could happen when you set up an observability system, and afterwards?
- Tool Overload and Data Silos: Without a unified strategy, teams often adopt different tools for logs, metrics, and traces. This leads to fragmented data, duplicated costs, and blind spots in your system visibility.
- Wasted Time and Budget: Setting up Observability tools yourself often results in months of trial and error. You might collect the wrong data, miss critical events, or end up storing everything (and paying for it) without knowing how to use it. Without clear goals and best practices, your observability investment quickly turns into an expensive mess.
- System Blindness: Without proper setup, you won’t know what broke or how to fix it, leading to missed performance bottlenecks.
- Slower Incident Response: Without expert-configured alerting and response workflows, your team might take hours longer to detect, respond to, and recover from incidents.
- Compliance and Security Risks: Poorly managed log data can lead to data leaks, privacy breaches, and non-compliance with regulations like GDPR or HIPAA. A consultant ensures you collect the right data and protect it the right way.
Free Observability
Assessment and Consultation
30-minute expert consultation
Custom improvement roadmap
Detailed assessment report
WeAre Observability Hub
Implementing observability can be complex, and that’s where partnering with experts can make all the difference. WeAre Solutions Oy is a leading Splunk Elite Partner and a team of specialists in observability services.
WeAre Observability Hub is our out-of-the-box package service that brings all monitoring + observability into one place, so teams don’t need to do it all manually. With dedicated tool, all data is constantly collected and analysed.
Why choose Observability Hub?
- Combined tools and expert support so businesses see what’s happening inside their systems.
- Observability Hub helps teams prevent problems, not just react to them.
- Unified visibility across all parts of technology — even cloud, servers, and apps. 📌 It’s like giving your business a health monitor and early warning system.
Facebook
Twitter
LinkedIn