
Fix Slow Performance in Splunk | Splunk Health Check Guide 2026
Key takeaways
- A working Splunk environment isn’t always a healthy one. Issues often remain hidden until they affect performance or cost.
- Architecture needs to evolve as data volume and usage change.
- Data visibility is essential to control licensing and storage costs.
- Most Splunk performance issues are caused by inefficient usage, not the platform itself.
- Strong governance improves security and maintainability.
- Regular Splunk health checks help keep the environment efficient and scalable.
Introduction
Many organizations assume their Splunk environment is working fine because dashboards load and data is searchable. In reality, hidden inefficiencies often build up over time and eventually lead to Splunk performance issues, rising costs, and unreliable data.
A structured Splunk health check helps uncover these problems early. It provides visibility into how Splunk is used, where resources are wasted, and what needs to be optimized.
This guide explains the most common causes of performance issues and how to fix them with practical, high-impact improvements.
What is a Splunk health check?
A Splunk health check is a structured review of your Splunk environment that evaluates performance, data ingestion, architecture, security, and storage usage.
It helps answer critical questions such as:
- Is Splunk performing efficiently?
- Is data being used effectively?
- Is the environment scalable and secure
By analyzing these areas, a Splunk health check provides a clear roadmap for improving performance and reducing unnecessary costs.
Get your PDF Splunk Assessment Checklist
Download the complete Splunk checklist, prepared by our experts. Simply fill in the form below — we promise not to send you any spam.
Thank you!
You have successfully joined our subscriber list.
5 Common Reasons Why Splunk Performance Issues Happen
1. Outdated Architecture
Many Splunk deployments start small and evolve organically. What works in the early stages often becomes a limitation later. Architecture gaps are what make Splunk perform slow and become a liability for the team.
Common findings include:
- Single indexers carrying cluster-level workloads
- No separation between search heads and indexers
- Deployment server managing apps beyond its design
- Year-one decisions still running year-five volumes
This type of architecture may have made sense initially, but as data volume and usage increase, it becomes inefficient and difficult to scale. Without revisiting the design, performance and stability inevitably suffer.
2. Uncontrolled and Poor Data Ingestion Control
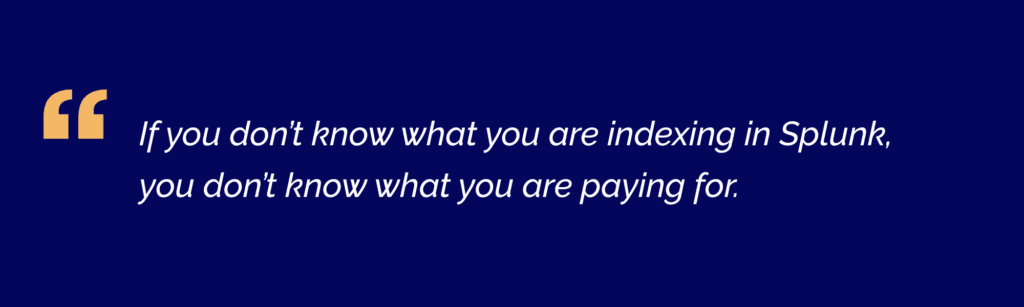
One of the most overlooked areas is data itself – what’s coming in, and why.
Typical issues include:
- Forwarders silent for weeks – no alert configured
- Indexes nobody searches, license volume nobody owns
- Sourcetypes left on automatic – field extraction breaks
- And remember: all JSON is not the same
When organisations don’t have visibility into their data, they also lose control over costs. We’ve seen customers using up their daily data volume for indexers that haven’t been checked for up to even six months. Monitoring Splunk health leads to savings on license costs.
Source type configuration is another frequent problem. Poorly defined or automatically assigned source types can:
- Break field extractions
- Impact CIM compliance
- Make data harder to search and analyse
Not all data formats behave the same way, and assuming they do can lead to long-term complications.
3. Inefficient Searches and Dashboards
Splunk performance problems are often misunderstood. In many cases, the platform itself is not the issue. Users think Splunk is slow, but it’s not the truth – it’s been asked to do things that it was never designed to do at that frequency.
Instead, the way it is used creates unnecessary strain:
- Scheduled searches on index=* with no time range
- Real-time searches from demos are never disabled
- Dashboards are taking 45+ seconds to load
- Skipped searches; nobody is alerted about
These patterns put continuous pressure on the system. Scheduled searches are run too frequently or without proper time constraints. Real-time searches are left running after testing or demonstrations. Dashboards are built on unoptimised queries.
A closer look at the scheduler often reveals the root cause.
4. Gaps in Security and Governance
Governance is rarely prioritised, but it has a direct impact on both security and usability. Companies devote a great deal of time, resources, and money to protect their systems, yet they often neglect to configure Splunk properly in this regard.
Common findings include:
- Admin accounts for staff who left years ago
- No RBAC strategy – everyone sees everything
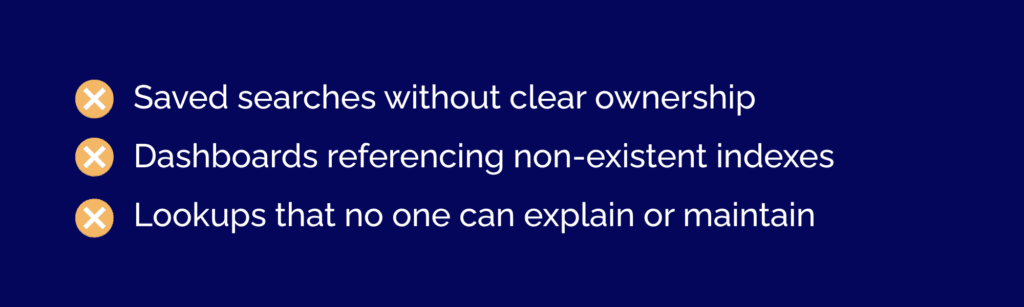
- Saved searches with no owner
- Dashboards referencing deleted indexes
Without proper governance, a Splunk environment becomes increasingly difficult to manage and more vulnerable to risks such as privilege escalation or a data breach.
5. Storage and Governance Issues
Storage is another area where inefficiencies quietly accumulate and drain a company’s budget.
Typical issues include:
- Retention policies are left at default settings
- Oversized hot buckets that don’t match actual usage
- Cold data stored on expensive infrastructure longer than necessary
- SmartStore is not configured, or configured incorrectly.
In many cases, organisations could significantly reduce costs by adjusting retention policies and moving older data to more cost-effective storage. Not all data delivers the same business value. The first step is to assess what insights the organization actually needs and which data support those outcomes.
While doing the health check, we review ingestion rules, data sources, and retention policies. Low-value or unused data can be filtered, adjusted, or refined. At the same time, high-value data should be prioritized. We’ve described a similar solution for log management and storage in more detail in one of our recent case studies.
The final goal is not just to reduce costs, but also to ensure that licence usage is aligned with real business needs and that the platform delivers measurable value.
Signs You Actually Need a Splunk Health Check
A Splunk environment usually shows clear signals before major issues appear. Slow searches, delayed dashboards, and rising licensing costs often point to inefficiencies in data ingestion or usage.
Other common indicators include unreliable data, excessive or missing alerts, and unclear ownership of dashboards or searches. If your environment has grown without regular review or if access controls are outdated, a Splunk health check is needed to restore performance and control costs.
Common Splunk Admin Mistakes
As Splunk environments evolve, the same patterns appear across organizations. Architecture does not keep up with growth, data is poorly managed, and usage becomes inefficient over time.
Governance often drifts, which creates security risks and confusion around ownership. At the same time, storage costs increase due to a lack of optimization. These issues are usually not caused by Splunk itself, but by how it is configured and used. Most can be resolved through targeted improvements once identified.
Benefits of Regular Splunk Health Checks
A regular Splunk health check helps maintain performance and cost efficiency. It reduces licensing waste by improving data ingestion and filtering unnecessary data. It also improves search speed by identifying inefficient queries and overloaded dashboards.
In addition, it increases data reliability, strengthens security through better access control, and ensures the platform can scale with growing data volumes.
When Should You Run a Splunk Health Check?
A Splunk health check should be performed after significant changes, such as increased data volume or new use cases. It is also important when performance issues appear, including slow searches or unreliable dashboards.
Running a health check on a regular basis helps prevent hidden issues from building up. It is also recommended before audits or migrations to ensure the environment is stable and optimized.
Splunk Health Check Tools & Methods
A Splunk health check can be performed using built-in tools and manual analysis. The Splunk Monitoring Console provides preconfigured checks that evaluate system performance, indexing health, and resource usage. These checks run as searches and highlight issues based on severity levels, which helps teams prioritize actions.
The Monitoring Console can also be customized. Teams can adjust thresholds, disable unnecessary checks, or create new ones tailored to their environment. Additional checks can be added through the Splunk Health Assistant Add-on to extend visibility.
Health checks can also be converted into alerts to detect issues early. This allows teams to respond to performance problems before they impact users. You can learn more about Splunk health check capabilities in the official documentation here.
While these tools provide strong visibility, they still require interpretation and ongoing optimization. Many organizations choose to combine native tools with expert-led reviews to get a deeper understanding of their Splunk environment. That’s why a specialized Splunk partner, such as WeAre, can help perform a more comprehensive assessment and improve overall performance and efficiency
Conclusion
A Splunk environment does not need to fail to become a risk. In many cases, the biggest challenges come from systems that appear stable while inefficiencies continue to grow in the background.
A Splunk health check provides a clear view of how your environment is performing and where improvements are needed. It helps reduce costs, improve performance, and make the platform easier to manage over time.
If your environment has not been reviewed recently, it is a good time to take action. At WeAre, we help organizations assess their Splunk environments, identify improvement opportunities, and align performance with real business needs. You can start with an observability assessment to understand your current state, or contact our team for a more detailed Splunk health check.
Free Observability
Assessment and Consultation
30-minute expert consultation
Custom improvement roadmap
Detailed assessment report
Facebook
Twitter
LinkedIn