
Case Study: Modernizing Survey Analytics with Cloud-Native Observability
For any large organization, internal surveys are a goldmine of information, crucial for tracking team maturity, ensuring best practices, and driving continuous improvement. One of our major clients in the retail sector was facing a common but significant challenge:
“Their valuable survey data was locked in one system, while their observability tool was in another.”
This disconnect created a slow, manual process that failed to deliver the timely insights they needed.
The Challenge: A Disconnected Data Puzzle
The core issue was simple: the client’s survey platform held all the raw data, but couldn’t support advanced analysis or visualizations. Meanwhile, their observability tool, Splunk, had the right capabilities but didn’t have direct access to the survey data.
How AIOps Enhances ObservabilityThe Initial Fix: Helpful, but Manual
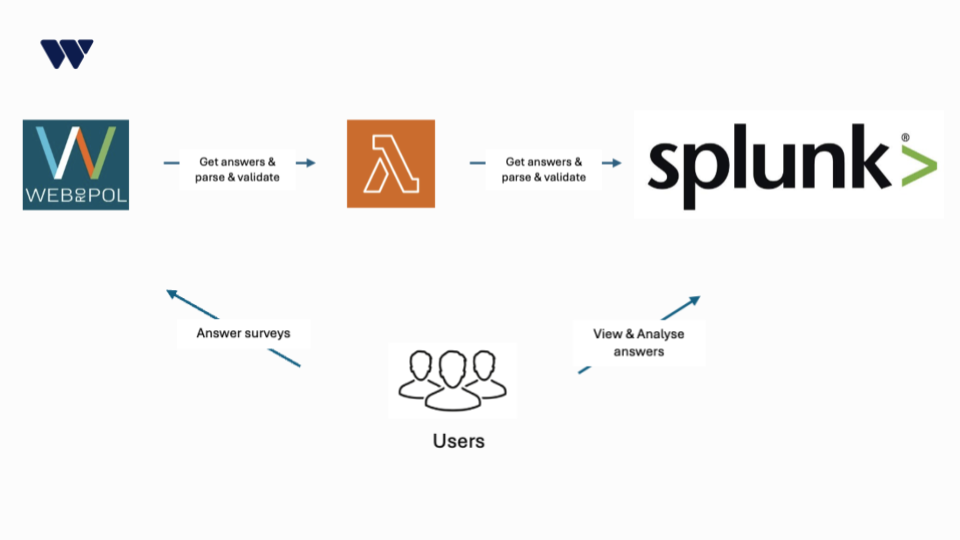
Our first solution focused on connecting their survey data (collected via Webropol) with Splunk for dashboarding and analytics. The process worked as follows:
- A team member manually downloaded survey data as CSV files
- A custom Python script (developed by our team) validated and normalized the data before uploading it to AWS S3
- AWS Lambda was triggered to forward this data to Splunk
- Finally, dashboards displayed the metrics for stakeholders
While technically sound, this setup required repeated manual effort and didn’t support continuous data flow. As more surveys were introduced, the friction increased.
Learning and Evolving: What the Client Really Needed
It quickly became clear that the client preferred a hands-off approach. They wanted:
- No manual steps in the workflow
- Up-to-date dashboards as new survey responses came in
- A flexible system that could accommodate additional surveys over time
This feedback shaped the evolution of the solution.
The Final Solution: A Fully Automated Data Pipeline
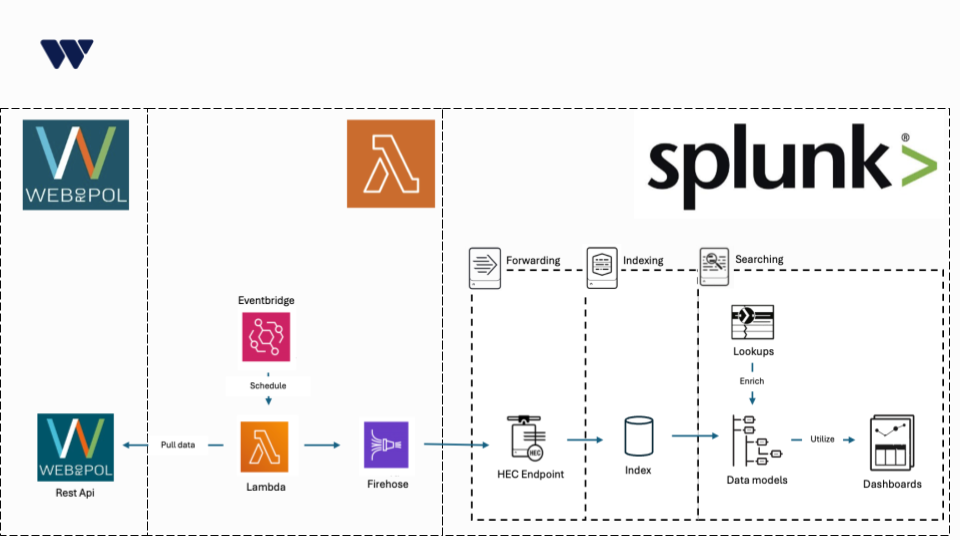
Taking this feedback, we engineered a new, fully automated solution. This new architecture is built around a single, powerful AWS Lambda function that handles everything without any human intervention:
- Scheduled Fetch: Using Amazon EventBridge, the Lambda function runs automatically.
- API Integration: It calls the survey platform’s REST API to fetch the latest survey responses directly. No more manual downloads.
- In-Flight Processing: The function instantly validates, normalizes, and transforms the raw data into a clean, consistent format.
- Direct Ingestion: The processed data is sent straight to the Splunk HTTP Event Collector (HEC), making it immediately available for analysis.
The Power of Smart Data Handling in Splunk
Getting the data into Splunk is only half the battle. To make it truly useful and future-proof, we leveraged key Splunk features. Once the survey data arrived in Splunk, we organized it to be useful for years to come by:
- Standardizing with Data Models: We used Splunk Data Models to give all survey data a single, consistent format. This means that even if future surveys change, the dashboards won’t break. We only have to adjust the model, not every chart.
- Keeping History with Lookups: Things change, like team names. We used Splunk Lookups to connect old names to new ones. This ensures historical charts are always accurate and no data history is lost.
- Easy Analysis for Everyone: With the data properly organized, the team could easily view dashboards, track improvements over time, and explore the results on their own.
The Business Impact: More Than Just Automation
By listening to our client and evolving the solution, we delivered a system that truly met their needs and unlocked several key benefits:
- Zero Manual Labor: Freed up valuable employee time to focus on analyzing insights rather than managing data.
- Timely & Accessible Data: Teams and stakeholders can now access near-real-time dashboards to track their progress and make informed decisions.
- Robust Historical Analysis: The ability to accurately compare results over multiple survey periods provides a clear view of long-term trends and improvements.
- Scalable Architecture: The flexible design allows for the easy addition of new surveys in the future with minimal development effort.
Conclusion: Moving Forward with Smarter Survey Analytics
This case shows that impactful solutions are born from listening, learning, and evolving together. By automating survey data flows and leveraging observability tools like Splunk, our client reduced manual effort, enabled wider access to insights, and gained the ability to track historical trends; all while preparing for future survey growth.
Is your organization still navigating data silos or manual reporting headaches? Let’s work together to build a smart, automated pipeline that turns your data into real-time insight.
How WeAre Can Help
WeAre is a technology company focusing on observability. Our services support technology teams to manage business-critical digital services with confidence. Our Observability as a Service (OaaS) offering provides real-time insights across your entire technology stack, ensuring systems remain reliable, optimized, and resilient. By proactively preventing problems, we help you focus on your business goals without compromising performance.
You can learn more about our Observability as a service (OaaS) from here, and let us show you how observability can help you run resilient businesses that are built for real-world success.